An Introduction to Dividend Sensitivity
This is a guest contribution by Nick McCullum from Sure Dividend. Sure Dividend uses The 8 Rules of Dividend Investing to systematically identify and rank high-quality dividend stocks suitable for long-term investment.
At Sure Dividend, we believe that long-term dividend growth investing is a suitable investment strategy for many self-directed investors who want to consistently build wealth over long periods of time.
Dividend growth investors generally have two goals:
- To generate rising dividend income over time;
- To grow their portfolio value through a combination of dividend payments and capital gains;
Both of these investing outcomes (growth in dividend payments and upwards movements in stock prices) impact a company’s dividend yield.
This article will discuss dividend sensitivity, a concept that allows investors to understand the impact of both changes in dividend payments and changes in stock prices on a company’s dividend yield when they occur simultaneously.
Changes in Dividend Yield with Respect to Changes in Dividend Payments
Dividend growth investors generally seek to identify stocks with a strong likelihood of generating rising dividend income over time.
Baskets of stocks like the Dividend Aristocrats (stocks with 25+ years of consecutive dividend increases) and the Dividend Kings (stocks with 50+ years of consecutive dividend increases) are highly likely to meet these goals.
Accordingly, investors should understand how rising dividend payments impact dividend yields over time.
Looking at the mathematical definition of dividend yield can be helpful:

The equation for dividend yield implies that dividend payments and dividend yield are directly proportional to one another. In other words, an increase in dividend payments (say, 10%) will result in a proportionate increase in the company’s dividend yield (also 10%).
Investors should also be concerned with the yield on cost of their portfolio holdings. Yield on cost is similar to traditional dividend yield except for the fact that it only concerns itself with the purchase price of the investment in question. In other words, price fluctuations do not impact yield on cost calculations, although increases to dividend payments certainly due.
The mathematical definition of yield on cost is:
Yield on cost has the same one-for-one direct relationship with dividend payments that the traditional dividend yield does.
Because of the nature of yield on cost calculations – dividend payments are allowed to increase but purchase price remains fixed – long-term investors who implement a dividend growth investing strategy can sometimes achieve remarkable double-digit yield on costs over time.
The next section discusses the impact of stock price of dividend yields.
Changes in Dividend Yield with Respect to Changes In Stock Price
The second factor that impacts a company’s dividend yield is its stock price. We can again see how this input variable effects dividend yield by turning to its mathematical definition:
The relationship between dividend yield and stock price is the opposite relationship that exists between dividend yield and dividend payments. In other words, dividend yield and stock price have an inverse relationship. When stock prices increase, dividend yields decrease; conversely, falling stock prices results in higher dividend yields (and better buying opportunities).
The next section discusses an analytical technique that investors can use to assess the impact of both growth in dividend payments and changes in stock price will have a company’s dividend yield when they occur simultaneously.
Dividend Sensitivity
The two factors that impact a company’s dividend yield are its annual (or quarterly) dividend payments and its current stock price. The answer to understanding what happens when they both change at the same time lies in a concept called dividend sensitivity.
Dividend sensitivity explains how changes to share prices and dividend payments effect a company’s dividend yield and is best represented in a ‘dividend sensitivity table’. We’ll use dividend growth stalwart Johnson & Johnson (JNJ) as an example of how to construct a dividend sensitivity table.
Johnson & Johnson currently pays a quarterly dividend of $0.84, which is equivalent to an annual dividend payout of $3.36. The company’s publicly-traded common shares are currently priced at $142.40. Using this information, Johnson & Johnson’s dividend sensitivity table would be constructed as follows:
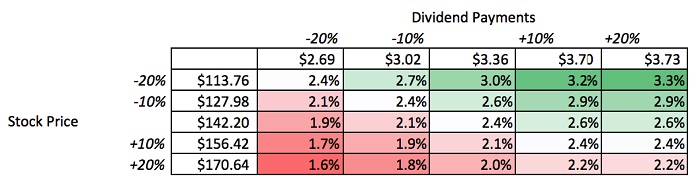
There are three main observations that should be pointed out to enhance readers’ understanding of how to interpret a dividend sensitivity table.
The first observation is related to what is contained in each row and column of the table. In the sample table for Johnson & Johnson, dividend payments vary horizontally and stock price varies vertically. This is not the case in every dividend sensitivity table.
Moreover, this sensitivity table varies in units of 10%. Investors actually have complete control over how much to play with the units in their sensitivity tables – while the sample table uses 10%, it might make sense to use 15% or 20% in some cases. Make sure that the units are meaningful, though – a large, stable business like Johnson & Johnson is unlikely to have 20+ gyrations in stock price or dividend payments in the near term.
The second observation is that dividend yield is maximized when both stock prices are lowest and dividend payments are highest. This is unsurprising – it agrees with our findings when we studied dividend payments and stock prices in isolation – but worth noting nonetheless.
The third observation is that the dividend sensitivity table does not provide any new information. Instead, it is an easy-to-interpret way of presenting data we already know. Just like a line chart can display a column of Excel cells in a way that makes it easy for users to make decisions, a dividend sensitivity table allows investors to comprehend the impact of changes in stock price and dividend payments will have on the dividend yields of their investments.
Final Thoughts
Dividend sensitivity tables allow investors to visualize the relationship between dividend yield, stock price, and dividend payments. They can be a useful tool to help investors understand how the dividend yield of their investments will fluctuate in response to changes in their input variables.
However, investors should be careful not to place too much emphasis on dividend yield alone. Other financial metrics – including the price-to-earnings ratio and the dividend payout ratio – are equally important than yield along. We encourage investors to pursue a holistic investment approach that incorporates a number of factors – focusing solely on dividend yield can be dangerous.
Recent Posts
- Forex Indicators: 4 Indicators Investors Should Know
- Best Money Clip: 10 Options to Secure Your Cash
- What is a Savings Account? Explaining Why You Should Have One
- Clarity Money Review: A One-Stop-Shop
- What Do Investment Bankers Do? Ultimate Guide
- Top 10 Best Investing Books
- Best Bitcoin Mining Software: Top 5 Revealed
- Depreciation Methods: Our Top 4 Picks


Leave a Reply