Image from Pixabay
Anyone considering trading on the Forex needs to know four key Forex indicators: moving average crossovers, moving average convergence divergence, relative strength indexes and Bollinger bands. These indicators show market trends and sentiments, establish trading ranges and show when prices are reversing. Every trader needs these four Forex indicators to trade successfully.
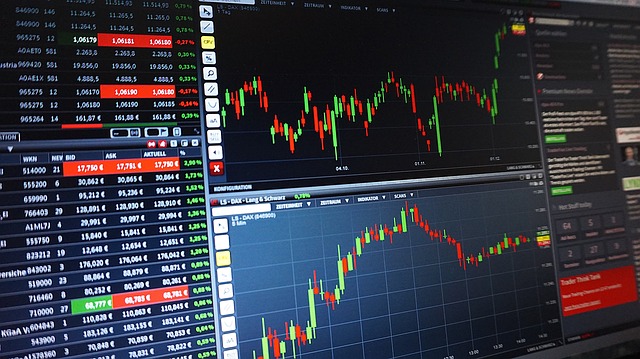
What Are Forex Indicators?
Forex indicators are calculations used in technical analysis of currency markets. Traders employ them in aid of many decisions, such as whether to go long or short and at what price points to buy and sell. Because they are leading indicators of price changes, traders rely on them to both enhance profits and cut losses.
Forex market indicators work by taking the volume and price of currencies into account and calculating ratios or generating comparisons that indicate strength of weakness. The mathematics of some indicators is highly complex and requires expertise. Many trading platforms have programs that calculate Forex market indicators and offer the option of entering them into trading graphs.
Psychological Forex market indicators measure market participant sentiment. Since markets are highly influenced by sentiment, psychological indicators need to be taken into account. Many times, technical indicators may be at odds with sentiment, causing, at least in the short term, prices to move in the opposite direction of where technical indicators logically point.
The Benefits of Forex Indicators
Trading the Forex without leading indicators is like playing the stock market by picking ticker symbols out of a hat. There are so many factors that drive the value of one currency relative to another, and few people can follow all the nuances. On top of that, the market is influenced by the sentiment of traders and trading patterns, including electronic trading. To make sense of market movements and identify where prices are likely to go, a data-driven strategy is necessary.
Below we explore the moving average crossover, the moving average convergence divergence, relative strength indexes and Bollinger Bands. Each provides a unique benefit.
Moving Average Crossovers
These are a building block of Forex trading strategy. Moving averages are the average closing prices over a specified time period. In Forex trading, moving averages of two currencies are used to determine upward or downward trends. With trends established, traders gain confidence in the direction of the market.
The Moving Average Convergence Divergence
This indicator serves as a check on moving average crossovers. Traders use it to check their theories of market direction, allowing them to change course if their original estimation of market direction is flawed.
Relative Strength Indexes
The relative strength index helps traders pinpoint the right time to enter a position. By using the relative strength index, traders make more profit and better control risks.
Bollinger Bands
Deciding when to take profits is one of the toughest decisions traders make. Bollinger Bands are a system that helps traders determine the realistic price range of a currency and sell at the top end of it.
Top 4 Forex Indicators to Know How to Calculate
The Moving Average Crossover Indicator
If you believe in the old adage, “The trend is your friend,” then the moving average crossover is the perfect Forex indicator for you. Certainly, following trends using the moving average crossover is far simpler than countertrend strategies and should be a mainstay in every forex traders’ toolbox. Some traders may use trend indicators as a trading system, but they are more useful when employed for the purpose of choosing between a short and long position on a certain combination of currencies.
First, recall that a moving average is the average closing price over X number of days. For example, one could calculate the 50-day moving average for the euro/yen cross. The moving average would be the 50-day closing average. A trader could then calculate the 200-day moving average for the euro/yen cross. These calculations would give the trader insight into the trends of this cross over both time periods. This might indicate that the euro/yen cross has been very bullish over 200 days, but that gains have slowed over the past 50 days.
Why Are Comparisons of Moving Averages Over Different Time Periods Important?
Because the theory behind the moving average crossover is that the trend is bullish when the shorter term moving average is above the longer term moving average and bearish when the longer term moving average exceeds the shorter term. This simple technique provides a reliable indicator of trends and a good method of selection between long/short positions. However, like all indicators, it is just one of many factors to be considered. Regardless of trend, there are always short-term gyrations that go against trend.
When applying the moving average crossover, the selection of time periods is very important. For example, comparing the 50 day and the 200 day crossover yields different insights than comparing the 10 day and 30 day crossover. The shorter crossover period allows traders to spot trend changes more quickly; however, it also has susceptibility to distort the traders view of the trend due to short-term swings that go against the true prevailing trend. Traders are wise to look at several crossovers and avoid tunnel vision.
Review
To gain insight into how a combination of currencies is trending, compare the moving average between shorter and longer time periods. When short term beats long term, the sign is bullish, while when the long term beats the short term, the market has turned bearish. Be careful to avoid overemphasizing short-term crossover result, as they may go against trend. Use several crossovers to get a more balanced view.
The Moving Average Convergence Divergence Indicator
The crossover helps traders spot trends; but before concluding what the trend is, wise traders seek confirmation. Taking the additional step to confirm the trend is important because, at times, traders can be fooled by shorter term gyrations and misidentify the market’s direction. If the crossover and confirmation indicators match, the trader can have high confidence in the market’s direction.
The moving average convergence divergence (MACD) is one of the most used confirmation indicators. To use this indicator, calculate the difference between two smoothed moving averages. Then, smooth the difference and compare it to its own moving average. When the current smoothed average exceeds its own moving average, an uptrend is confirmed; however, when it is below its own moving average, a downtrend is confirmed.
To use the MACD, you need to know how to determine the simple moving average and then the smoothed moving average. Click here to read about how to calculate these averages.
Smoothed moving averages have the benefit of keeping older data in the moving average calculation. The difficulty some traders see in simple moving averages is that older data is simply dropped off, which could create a false signal. Smoothed moving averages solve this problem by keeping older data but assigning it lesser weight than newer data, which provides a more robust view of trends.
Relative Strength Index Indicator
The relative strength index should be used after the trader determines the trend based on the moving average crossover and MACD techniques. These two indicators allow the trader to decide on a long or short position. Once this is determined, the trader must decide at what point to enter into a position. Should the trader act immediately or wait and watch for a better buying opportunity? A relative strength index answers this question.
For example, let’s say a trader has decided he or she is bullish on the euro versus the yen. If the trader wants to maximize profits and minimize risks, he or she should buy after a shorter term pullback; however, if no shorter term pullback occurs and the price shoots up, the trader has missed the best buying opportunity, decreasing the position’s potential and creating a more risky trade proposition. Using a relative strength index takes the guesswork out of this decision by revealing if the position is overbought or oversold.
The Relative Strength Indicator Score
The relative strength indicator generates a score between zero and 100. A zero indicates all the price action has been on the downside, while a 100 indicates it has all been on the upside. A score of 50 is neutral. The score is created by first choosing a window period and then calculating how many up days there were compared to down days for that time. A trader then must choose a trigger score, which is the point at which he or she enters the market.
For example, the trader might use a three-day relative strength indicator for a euro/yen cross and a trigger score of 20. A trigger score of 20 indicates the position is oversold. Therefore, a buying opportunity presents itself. On the opposite side, a trigger score of 80 shows the position is overbought, presenting a selling or short position opportunity.
Bolinger Bands Indicator
Estimating the relative strength of the market also applies to profit taking decisions. For example, a three-day relative strength index above 80 would indicate the position is over bought and it’s a good time to sell; conversely, a score of 20 would indicate the position is oversold, which is a good time to exit a short position. The Bolinger Bands strategy provides another device for making profit taking decisions.
Bolinger Bands strategy creates trading “bands” that endeavor to show traders when to enter and exit positions. The bands are constructed by taking the standard deviation of price fluctuations over a time period and then adding and subtracting them from the closing prices over the same time period, which establishes the band.
For example, 20-day Bollinger Band could be created for a euro/yen cross. When prices reach the upper end of the band, the trader should consider taking profits. Prices at the top of the band indicate the position is overbought. When prices reach the bottom of the band, traders should consider exiting short positions, as buyers are likely to soon enter the market and drive prices higher.
Conclusion
Trading on the Forex is a rewarding endeavor. However, currency trading is highly volatile and complex. Being successful on the Forex requires experience, skill and courage. It also takes discipline. Using Forex indicators allows traders to make disciplined decisions based on sound logic and avoid the sin of relying on luck.
Traders gain a tremendous edge when they consistently use moving average crossovers, check them with the MACD technique, purchase according to relative strength indexes and use Bollinger Bands to make selling decisions. These are four Forex market indicators every Forex trader needs to know.


Leave a Reply